
A dashboard is an easy to read, one page summary of the analysis of the information. It is an overview of your system at a glance. There are many advantages that result in the utilization of this tool. Some of the most important benefits are:
Dashboards are very important for any organization to know real-time data on the process, management, and flow of the business. The dashboard also provides a quick snapshot of the data in the form of a list, chart, or graph that can be quickly analyzed to provide better business reports. Dashboards in CRM help the organization to understand the overall performance on a real-time basis by consolidating the data and giving the result which would be faster and with accurate analytics.
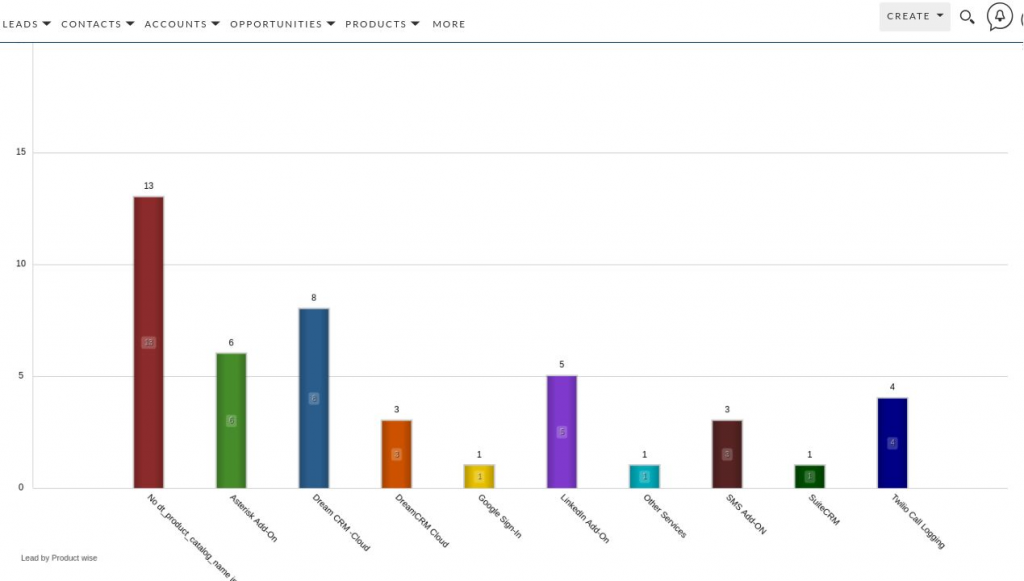
Column Report
DreamCRM provides dashboards using which the manager, team leader, or users can quickly know information about any CRM module Leads, contact, accounts, Open Opportunities, Quotation, invoices, AMC/contracts, Cases, and other daily activities like email, tasks, scheduled Calls, and meetings. Various dashboards can be consolidated into a single tab and multiple tabs can be created based on the user’s day-to-day requirements.
DreamCRM allows users to create dashboards for specific data that provide better insights into the business.
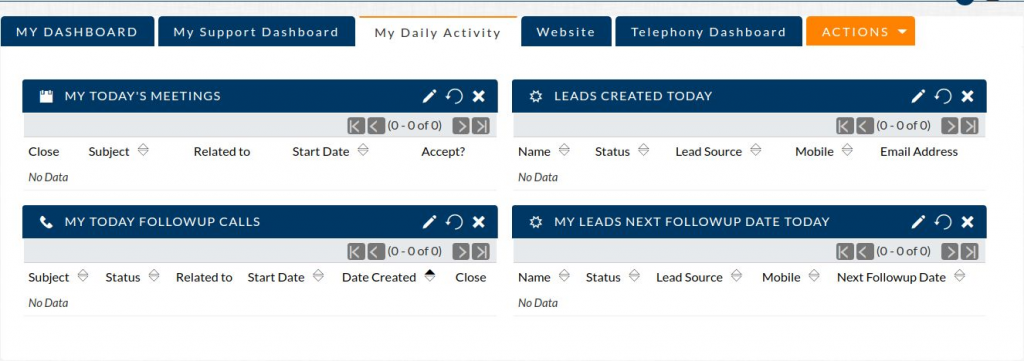
My Dashlets:
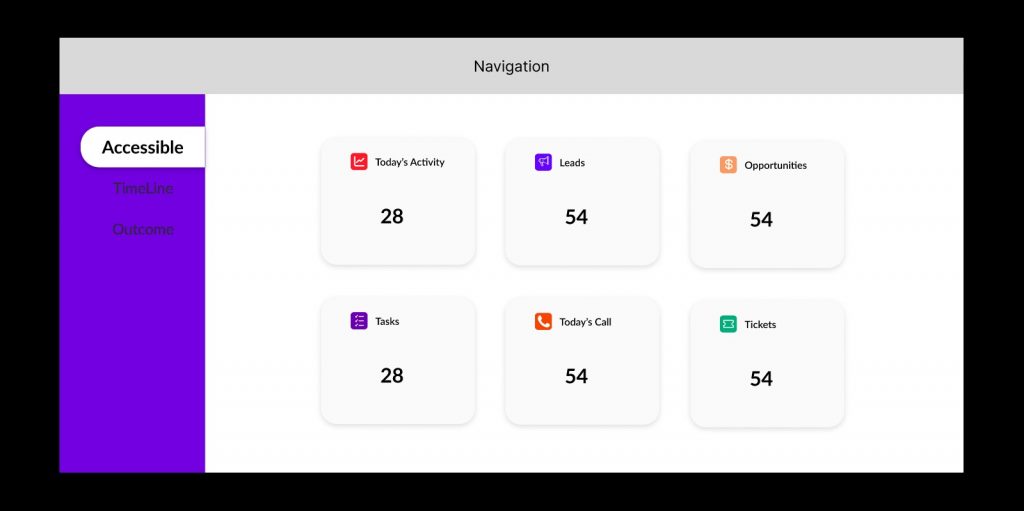
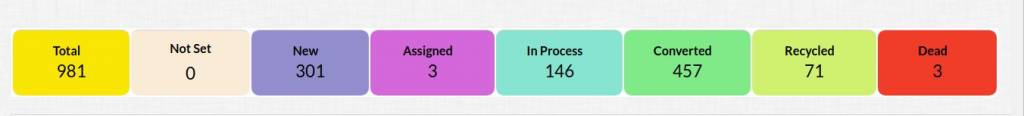
Count Dashboard
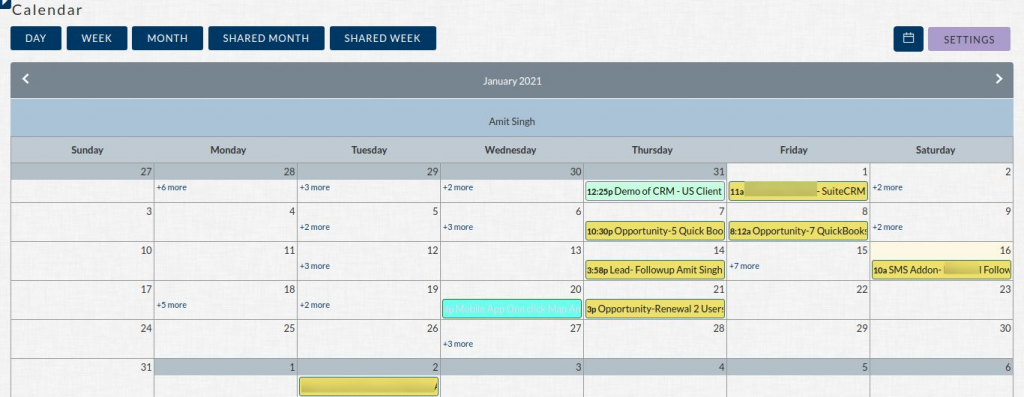
DreamCRM provides a set calendar on the Homepage. It is the quickest place to know our schedules planned for today, the next days, weekly, and months and makes the necessary plan to go everything well. Users can just click on any of the dates or time frames to schedule a task, call, or meeting.
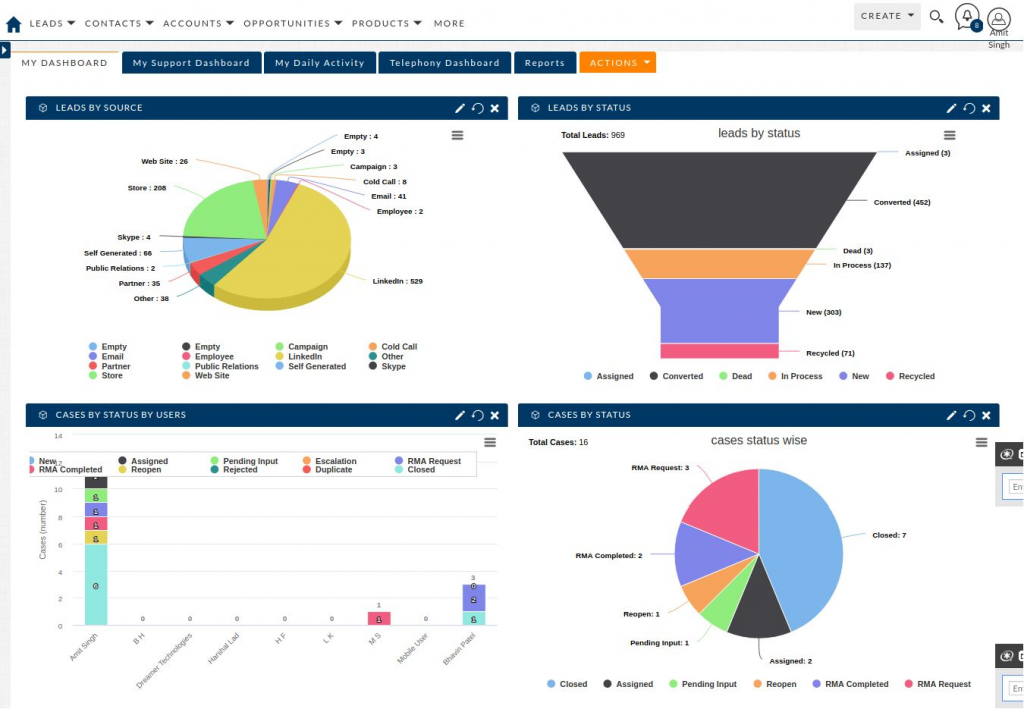
Useful Chart reports:
- Charts are used to provide the graphical representation of consolidated data on a high-level view where the manager would like to know the overall performance of the territory or a product or Business.
- An organization will always like to know the revenue that will be generated from different campaigns. The Leads are generated from the campaign and then are converted to Accounts, Contact, Opportunity. Based on the type of the campaign or from where the lead is generated, Leads are classified based on the Lead Source.
- To know the outcome generated based on the Lead Source and the stage of the opportunities. The tabular form will be difficult to read and understand data. So a graph is shown which shows clear and understandable data.
- To create a Chart, go to actions from the home page and click add dashlets.
Advantages of using Dashboards in DreamCRM
Undoubtedly, as you would have imagined the power of Dashboard, Dashboards are immensely useful in any CRM. Listed below are the main advantages of using this tool within DreamCRM.
- Real-time data can be viewed
- Get real-time updates of any change in the underlying data or values is reflected in dashboards immediately. This helps you to identify fluctuations in key business metrics as soon as they happen without having to wait for daily or weekly reports.
- More data for reference in one place at any time.
- Interactive dashboards allow options to filter and drill-down data as per user requirements. This will help ensure maximum benefit for a broad range of users.
- Know scheduled Tasks, Calls, and meetings of users or groups of your team.
- Quick Analysis of Monthly, Quarterly, Half-Yearly, and Yearly Sales outcome
- Grouping and consolidating the data and representing the data for better business reports
- Keep track or monitor the Sales, Marketing, and Service Teams on their performance
- To Follow up with the Leads holding top opportunities that can be closed
- Focus on high-level results and drill down as needed through multiple levels
Conclusions:
CRM Dashboard is one of the most important and essential for any organization to quickly analyze the CRM data and have a robust decision that could benefit the company. The manager, team leaders, and users can easily monitor their sales stage pipeline, and opportunities that could be closed, and know the outcome by team or territory.